

Do fresh users regularly browse your news website? Do your stories create a lot of traction or hardly any at all?
Without the ideal bait (crystal-clear audience data) and a sharp hook, picture yourself going fishing in a wide ocean. You are merely flinging into the chasm. In order to entice new readers and maintain their interest, you must understand:
Who’s paying attention?
What draws the reader in?
What draws people back for more?
This blog explores the use of analytics in news media, how to use analytics to drive more visitors, and how the built-in analytics tool in CMS works.
Editorial Analytics:
- Editorial decision-making is empowered and guided by the use of editorial analytics, which comprises the collection, analysis, and interpretation of audience data and metrics.
- With the use of editorial analytics, news companies can create unique data sets that are suited to their objectives and organizational requirements. Examples of these data sets include editorial decision assistance, audience engagement tracking, and content performance analysis.
- For news organizations to remain competitive in a media landscape that is continuously evolving, editorial analytics is essential.
Newsrooms may create more individualized stories and content if they have access to the appropriate analytics. Loyal readers are impacted by valuable content and are given a sense of exclusivity.
Renowned media conglomerates such as The New York Times and The Wall Street Journal greatly depend on audience statistics to fine-tune and redirect their content initiatives.
Simple Metrics to Advanced Data Analysis:
The field of news analytics has progressed from basic metrics to sophisticated data analysis that integrates machine learning (ML) and natural language processing (NLP) methods.
These days, the majority of news organizations are creating different kinds of analytics to gather useful information to support their editorial agendas. It can be overwhelming to try to sip from a firehose with all of the data available. The three factors that determine which ones are most important to your newsroom
- Specialization
- intended audience
- Location data
We’re not here to saturate you with information. To avoid becoming overwhelmed, let’s instead cut through the clutter and concentrate on what matters most in order to obtain a clear image. To give you a general understanding of what matters, let’s analyze it.
Attention Time:
What is it: How long a reader spends on a page is measured by attention time. They are interacting with the content actively throughout this period. It reveals the extent to which your audience engages with your material on a deeper level than clicks and page views.
How to Find It: Analytics systems offer this information by tracking whether users browse, click, or interact with a page to determine how long readers spend on a specific piece.
Why This Is Important: Knowing how long readers spend with your material allows you to determine whether or not they are engaging with it thoroughly. It can reveal whether individuals react strongly to an item or if they move on soon, maybe expecting something else.
Traffic from Referrals:
What is it: Referral traffic reveals the source of your readers, be it search engines, social media, or direct connections. It provides information on the channels that are most engaging to users.
How to Find It: A breakdown of referral sources is usually provided by analytics software. Using these tools, you may monitor whether external websites or social media networks refer readers to you.
Why It Matters: Knowing what kind of traffic referrals are will assist you in choosing how to promote your content. It helps businesses determine which social media postings and headlines perform the best, enabling them to adjust the way that material is promoted.
Bounce Rates:
What is it: The percentage of visitors to your website that leave after only reading one page is known as the “bounce rate.” A high bounce rate may be a sign that your content needs to be updated to better meet the expectations of readers or made more interesting.
How to Find It: You can simply track bounce rates for each page on your website by using tools like Chartbeat and Google Analytics (GA).
Why It Matters: It’s critical to lower the bounce rate and retain readers on your website. Through the process of identifying pages with greater bounce rates, editors can pinpoint areas of concern and implement the necessary fixes.
Engagement and Social Shares:
What It Is: A straightforward tally of the shares and interactions (likes, comments, and retweets) on your social media post.
How to Find It: NewsWhip and other tools provide comprehensive information about the performance of stories on social media. They display the most popular content as well as the users sharing it.
Why It Matters: Social media shares show how well your content engages readers. Greater exposure equates to more shares, but it’s crucial to assess whether those shares result in genuine interaction or just clickbait.
Geographical Data:
What is it: Geographical data provides insights into regional interests and interaction patterns by displaying the location of your audience.
How to Find It: You can identify which stories resonate in different places by using analytical tools that track and provide information about the locations and backgrounds of your audience.
Why This Is Important: Using geographic data in your content creation will help you reach target audiences. You may verify the effectiveness of your tactics and make sure the stories are having the desired effect.
Other measures beyond the basic method include reach, recirculation, entry rate, conversion rate, engaged time, concurrent visit, conversion rate, click-through rate, page views per visit, and unique users.
Connect Metrics with Measurement:
Finding the ideal rhythm in a song is similar to connecting metrics and measurements; it enables you to comprehend how your audience is responding to your material.
When journalists are presented with raw data, they may ignore it or decide to take extra time to thoroughly examine the information before making a decision.
An effective analytics tool can help in this situation. Those daunting figures ought to become comprehensible, clear images thanks to it. Consider infographics as interpreters that make difficult-to-understand stuff simple to grasp at a glance.
To demonstrate how these figures affect the day-to-day grind, there must be a strong correlation between metrics and measurements, though, so it’s not just about attractive charts.
Reach
If breaking news cannot leave your newsroom, what good is it? Reach is supreme. You should utilize metrics like impressions, sessions, and unique users to determine how widely an article has been shared.
Engagement
It’s time to sort the wheat from the chaff and find out who is actually reading this instead of just browsing. Examine session duration, engagement duration, and the amount of time readers spend using your app or certain stories.
Loyalty
A loyal audience is like receiving love notes. Pay attention to regularity, recurring visitors, and repeat subscriptions if you’re interested in learning more about loyalty.
Emails, letters to editors, campaign results, and subscription count will all show you how big of an impact your content has.
The crucial point to remember is that you need to configure your analytics tool’s metrics with the appropriate pattern in order to link them to significant measurements. The journalists will thus be able to modify their work for optimal impact, knowing precisely when, where, and how to do so.
Best Practices in Editorial Analytics
Editorial analytics best practices include employing sophisticated analytics tools, setting precise goals and objectives, and giving data scientists and analysts resources and training.
To gain a deeper understanding of their audience, news organizations must employ both qualitative and quantitative approaches.
Another critical component of success is to regularly review and modify the editorial analytics plan.
BOLD’s Inbuilt Editorial Analytics Tools
Envision a situation where you have an abundance of crucial narratives at your disposal and you are not dependent on other vendors for your analytical needs. Imagine having all you need at your fingertips thanks to your CMS.
Yes, BOLD CMS provides that. It saves you time, effort, and the headache of dealing with outside vendors by bringing the integrated story and author metrics directly to your dashboard.
It only takes a few clicks to obtain critical metrics once you are set up and have moved to BOLD CMS, allowing you to make data-driven decisions with ease. A preview of what BOLD’s built-in analytics tool can accomplish for you is shown here:
There’s an “Analytics” button in BOLD that leads to a wealth of information for your newsroom. Three primary sorts of analytics are offered by BOLD:
- Story Analytics
- Section Analytics
- Author Analytics
You can put up a custom range or concentrate on a particular day with each section’s customizable data range option. You can even identify trends by comparing two distinct time periods. Let’s examine each section’s benefits now:
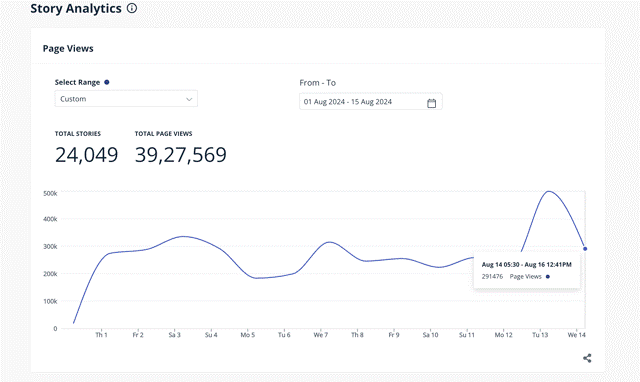
Story Analytics
An instantaneous overview of the performance of individual stories is provided by Story Analytics. A graph of page views from yesterday and today, color-coded in green and blue, respectively, is displayed when a daily range is selected.
Additionally, a graph showing the total number of stories that received page views is provided by the program. Based on page views, it presents the top 50 articles, making it easier for you to identify your best-performing content and plan more effective multichannel promotion.
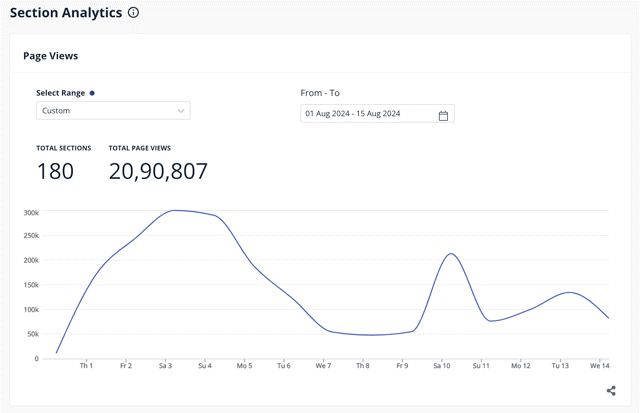
Section Analytics
The top 50 sections from the day before are available through Section Analytics. This feature’s brilliance is found in its capacity to identify the areas of your newspaper that readers find most compelling.
There are two important things you can do with this data:
- To capitalize on the success of your best-performing sections, promote them.
- To help underperforming portions improve, pay more attention to them.
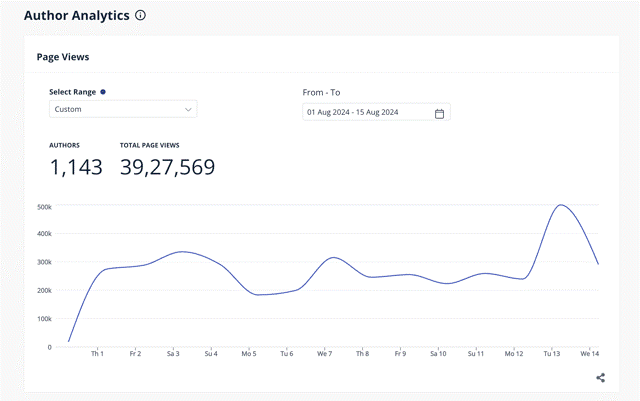
Author Analytics
Which writers have had the most page views in the last day are displayed by Author Analytics. It features the top 50 authors according to performance, just like the other tools.
This functionality is especially helpful because BOLD offers comprehensive author performance information, which GA4 does not do. In this manner, you can acknowledge exceptional contributions and make sure that everyone’s work is in line with the newsroom’s objectives.
The Future of Editorial Analytics
Technology and storytelling are two fields that are always changing. Newsrooms are now more prepared to engage with their audiences, produce powerful content, and navigate the digital era thanks to the advancements in artificial intelligence, machine learning, and social media analytics.
In the field of editorial analytics, emerging trends and technologies include natural language processing, machine learning, and artificial intelligence. For news organizations to comprehend their audience and produce interesting content, social media analytics are becoming more and more crucial.
Conclusion
The foundation of contemporary journalism is editorial analytics, which helps newsrooms create content that truly connects with their audience and goes beyond educated speculation.
The secret is to collect data and turn it into insights that can be used to drive engagement and define content plans. Our approach to storytelling needs to change along with technology, following the pulse of real-time data.
The future of journalism will go to those who can properly use editorial analytics, now more than ever. You are not just crunching numbers while using BOLD CMS; instead, you are precisely building tales under the guidance of real-time insights.
Reference: https://blog.quintype.com/business/editorial-analytics-for-digital-publishers


